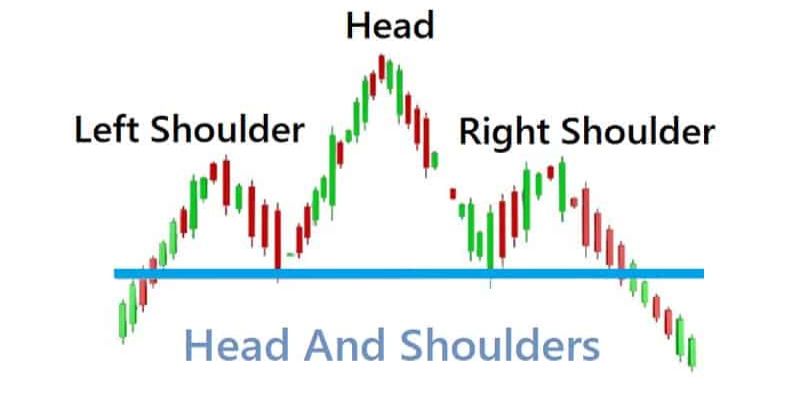
Head and Shoulders is a chart pattern that identifies a trend reversal. You will observe this formation when the bullish phase is about to transition to the bearish phase is ready to take over. The question for traders is how to use this pattern and how to spot a reversal. Let’s see in this article.
How to Spot Reversal Using Head & Shoulders
The Head & Shoulders chart pattern comprises three components. The formation begins with the left shoulder, created when the price surges and retreats. A higher peak or head follows this. After this peak, the price dips again and then makes a modest upward move, which pushes the right shoulder. Then comes the neckline. This trendline is drawn, connecting the lows between the shoulders and the head.
Here is how you can identify the reversal using the Head and Shoulders Pattern.
- Step 1: Validate if the prevailing trend is bullish. If yes, you will notice a price peak in the left shoulder, which pulls back a bit to form the first dip.
- Step 2: The price rallies again to form a new high above the left shoulder. This is the head. After reaching this new high, the price falls again near the same price point as the previous dip.
- Step 3: Look for another price surge, but this time, it must form a peak below the head and close near the left shoulder. This indicates weakening momentum.
- Step 4: Connect the two dips (after the left shoulder and after the head) with a straight line. This neckline is important for pattern confirmation.
- Step 5: Watch for volume surge as the price breaks below the neckline to confirm the breakout.
This helps you find a breakout. Let’s say a stock has been on a consistent uptrend and forms the following:
- Left shoulder: High of ₹950
- Head: High of ₹1,100
- Right shoulder: High of ₹980
- Neckline: ₹900
After the right shoulder, the stock drops and breaks below ₹900 with high volume. You could enter a short trade at ₹895, place a stop loss at ₹985, and set a target near ₹700 (₹1,100 – ₹900 = ₹200 projected downward).
If you wish to gain more knowledge about such patterns, you can consider Upsurge.club’s technical analysis classes online.
Strategies to Trade Using the Head and Shoulders Pattern
Here are three strategies to follow when trading using the Head and Shoulders pattern:
Classic Breakdown Entry Strategy
Open a short position as the price moves below the neckline support. Confirm the breakdown with increased volume. Set the stop-loss over the right shoulder, and define your target by measuring the distance from the head to the neckline, then projecting that same length downward. This strategy works best in trending markets.
Volume Divergence Confirmation Strategy
Employ volume to validate when trading this pattern. You should observe a decreasing volume on the formation of the right shoulder and an increased volume during the neckline breakdown. This divergence suggests weakening bullish momentum and gives you greater conviction to go short after the breakout.
Fibonacci Extension Targeting Strategy
Following the neckline break, use Fibonacci extensions to establish reasonable profit targets. Measure the height from the head to the neckline and apply Fibonacci levels (1.0, 1.618) downward from the breakdown point. This helps you exit positions based on structure rather than emotion, optimising your risk management.
Conclusion
The Head and Shoulders pattern is a powerful tool for spotting trend reversals. Although it is not foolproof, it offers a high-probability setup with confirmation and volume analysis. Learning this pattern can give you an edge in identifying turning points in the market. To understand more, you can enrol in Upsurge.club’s course on technical analysis.